ASpedia Manual
- AS Profile
- Knowlege-Based Signature
- Transcriptome Signature
- Neo-junction
- Alternative Splicing Database Introduction
- User Guide
- Sequence-based Annotation (DNA, Protein)
- mRNA Regulation Annotation
- Isoform-specific Function
- Input Format (BED file)
- AS ID Definition and Renaming Rule
- Result Download File Format
- Data process workflow for differential AS analysis
Alternative Splicing Database Introduction [ Top ]
ASpedia is a comprehensive functional annotation database for human alternative splicing (AS) events (including gene model hg19 ENSEMBL, and RefSeq). ASpedia supports the major classes of AS described below.
1. Skipped exons (SE)
2. Alternative 5’ splicing site (A5SS)
3. Alternative 3’ splicing site (A3SS)
4. Mutually exclusive exons (MXE)
5. Retailed intron (RI)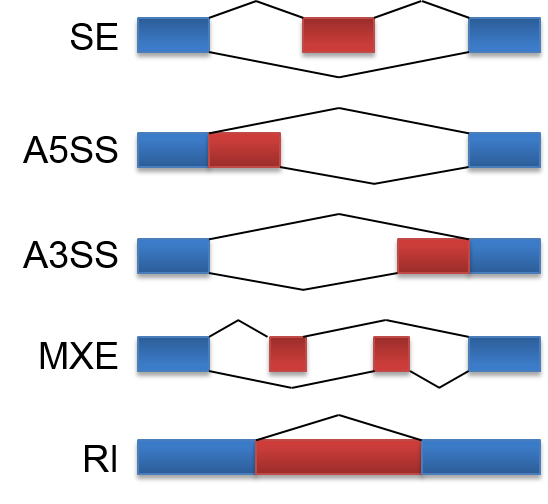
Given gene names or AS IDs, ASpedia provides:- Genomic annotation (DNA and protein): identify that various functional evidence around AS event regions were collected, for example splice site mutation, protein domain and so on.
- Transcriptional regulation and its elements: support AS expression values (percent spliced-in index, aka PSI) of multiple tissue samples and RNA binding proteins inferred from ENCODE project dataset.
- Isoform-specific function: clarify isoform-specific interaction and subcellular localization. We collected information from previous researches, PPI database, and UniProt.
- Genomic annotation (DNA and protein): identify that various functional evidence around AS event regions were collected, for example splice site mutation, protein domain and so on.
User Guide [ Top ]
ASpedia requires BED format input file or gene symbol list, and query matched AS IDs. AS annotation information of each AS event is visualized in our browser. The whole annotation result could be downloadable as text file format. Specific usage follows below steps.
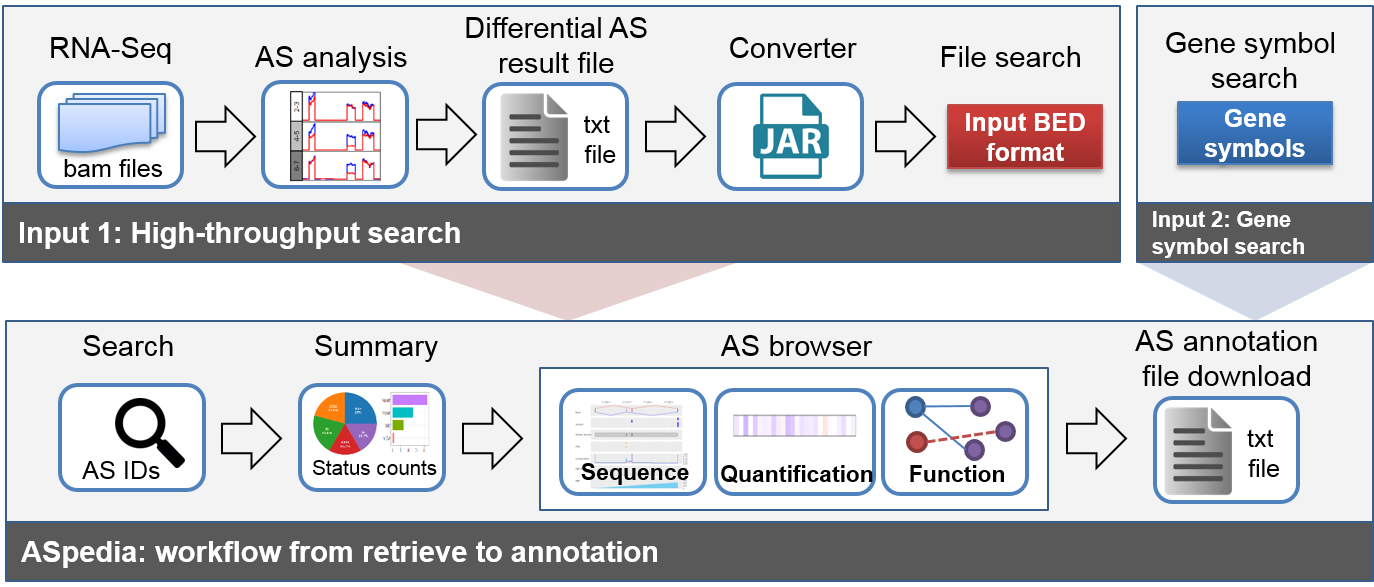
Figure 1 Input preparation and ASpedia usage workflow
Step1) Preparing input file or gene list
After differential AS analysis using RNA-Seq bam files, please convert the result file followed by input format.
Step2) Getting result summary
Query AS events were summarized in first search result page.
AS events were counted by each condition: AS event type, DNA annotation, Protein, Annotation, and so on.
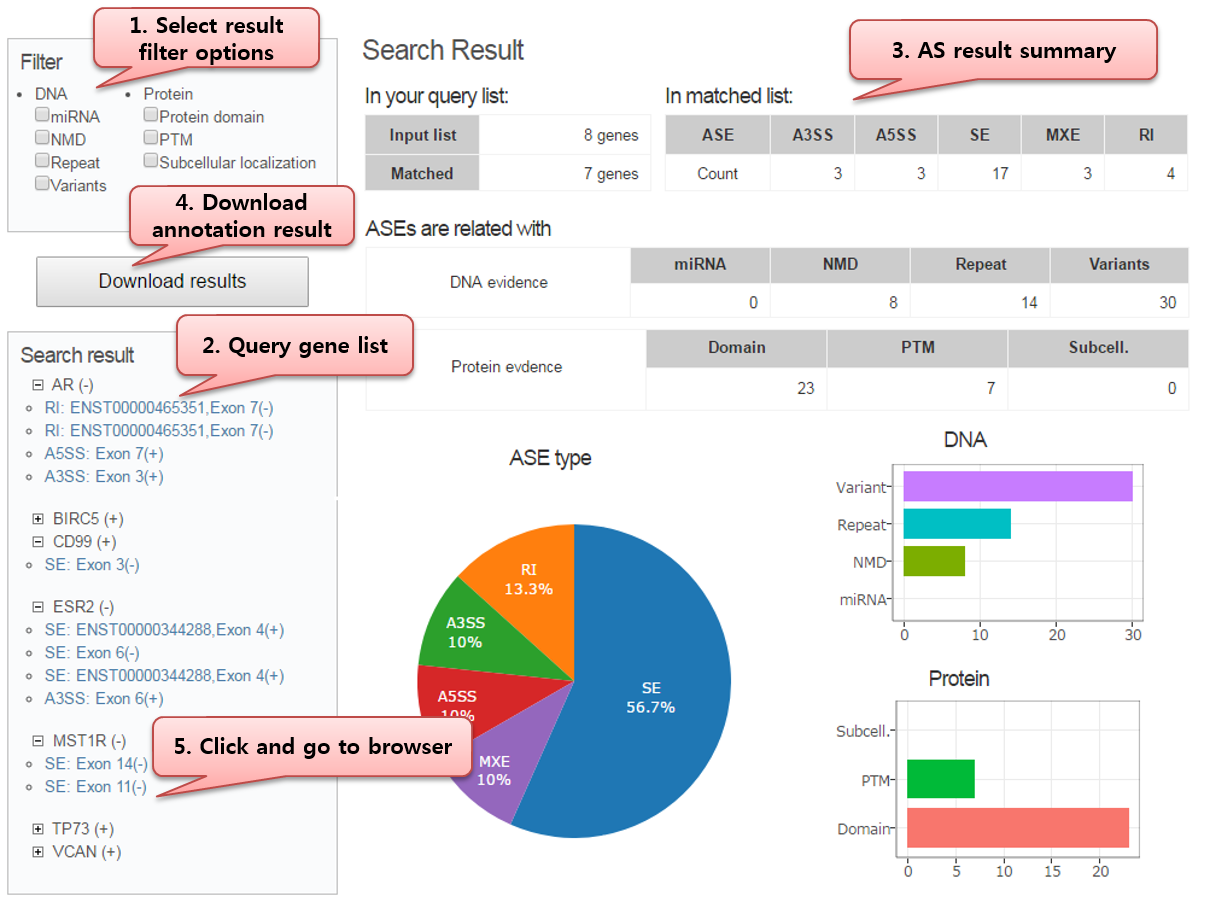
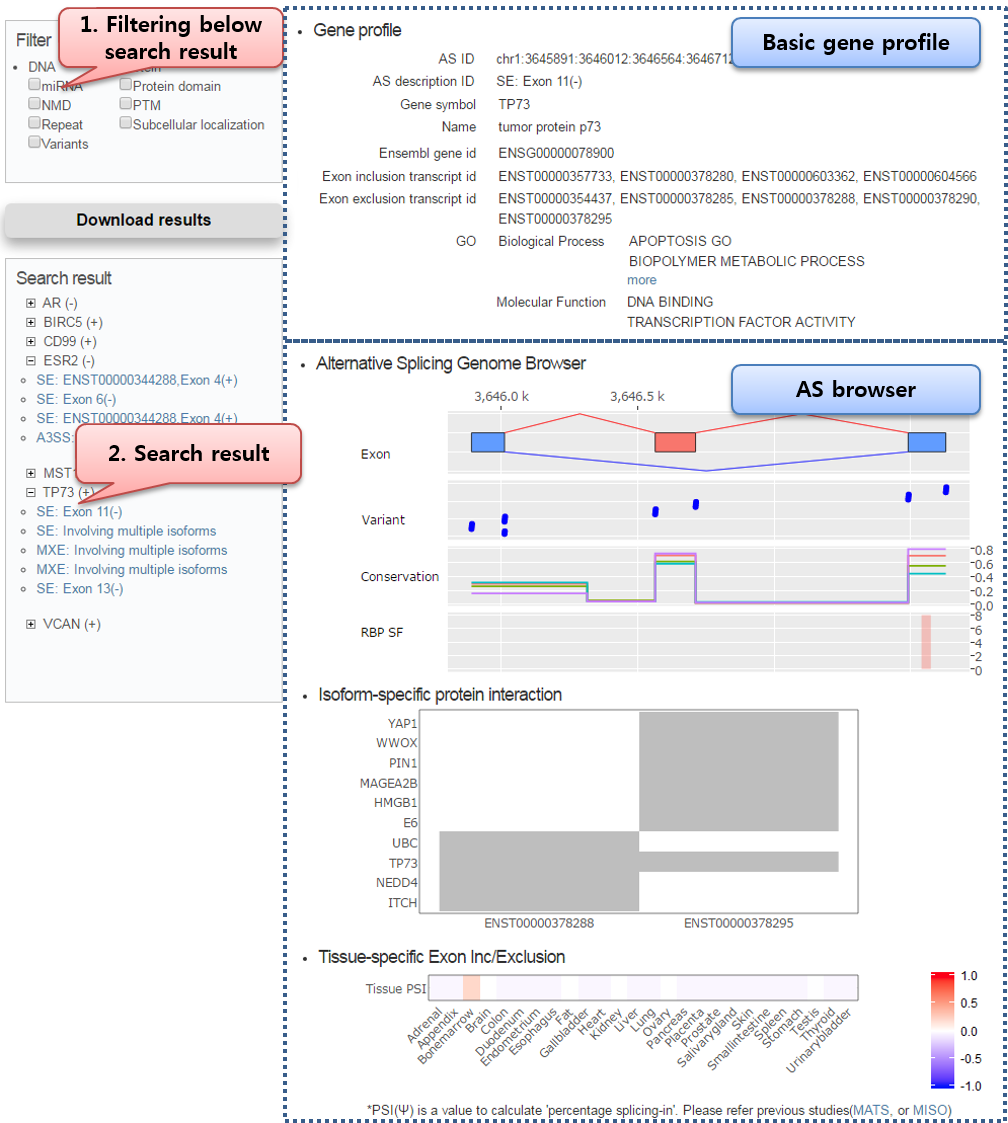
Step3) AS annotation result and visualization
Click AS ID of search result, and check specific AS information.
Our result page is composed of basic AS profile, and browser offering multiple tracks corresponding AS-specific dataset.
Sequence-based Annotation (DNA, Protein) [ Top ]
DNA/RNA and protein information was collected from sequence-based analysis around AS region. Data features were listed below. Please refer dataset counts.
Data type Description DNA/RNA miRNA target site miRNA binding sites of 3’ UTR region predicted by TargetScan NMD NMD sites collected from known stop codons, and novel variant stop codons inferring from dbSNP, and COSMIC Conservation Average conservation scores of exonic and intronic regions collected from phastCons40way placentralMammals, primates, and vertebrate Variants Variants (point mutations) of splicing site collected from dbSNP, COSMIC, and SPIDEX Repeat Various repeats collected from UCSC genome browser: Interrupted Rpts, microsatellite, RepeatMasker SelfChange and Simple Repeats Protein Domain Protein domain using Pfam Post-translational modification (PTM) PTM sites collected from PhosphositePlus including 9 types (acetylation site, kinase, methylation, phosphorylation, and so on.)
mRNA Regulation Annotation [ Top ]
mRNA regulation information was analyzed from NSG dataset collected from EBI and ENCODE project. Tissue specific AS expression was calculated as PSI value which means “Percent Spliced In” described in Katz et. al. (2010). We estimated PSI values running rMATS for paired-end RNA-Seq and replicated samples. RNA-binding proteins (RBP) platforms include RIP-Seq, CLIP-Seq.
Data type Status Description Tissue-specific AS 26 tissues and 241 samples Summary of tissue specific PSI values RBP 135 proteins including 38 splicing factors, and 434 samples Summary of RBP around alternative splicing regions, and peak detection p-values
Isoform-specific Function [ Top ]
The direct functional impact of AS could be described in isoform-level. ASpedia minded isoform-specific interaction, and subcellular localization from known database or experimental results. Each isoform could be traced by matched transcript ID involving in AS event.
Data type Description Protein interaction Isoform-specific protein interactions collected from Cell 2016, Nature Commun. 2014, and iRefIndex version 40 Subcellular localization Isoform-specific subcellular localization result collected from UniProt
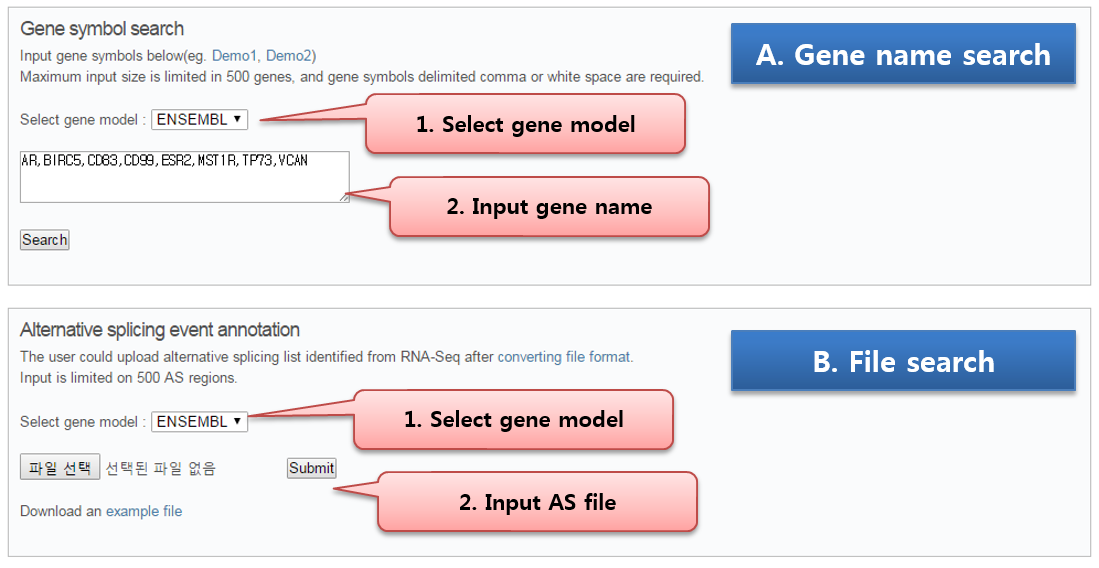
Input Format (BED file) [ Top ]
ASpedia requires BED input format, and some columns are mandatory fields. All columns should be tab-delimited, and please remove header line.
chrom* chromosome name starts with ‘chr’ chromStart* alternative splicing start location chromEnd* alternative splicing end location AS ID* AS ID defined by our rules score PSI value (optional) strand* Strand. Value is + or - AS type* alternative splicing event type classification (A5SS, A3SS, SE, MXE, RI) Miscellaneous additional values Additional columns (optional) Column* means mandatory field.
- Example:
Here is an example of input file to query AS event.
chr19 50361371 50361502 chr19:50361314:50361371:50361502:50361806:50361910 0.108 + A5SS 38,50,36,53,89 15,16,21
chrX 153128823 153128932 chrX:153128999:153128932:153128823:153128349:153126973 -0.655 - A5SS 0,0,1,0,2 44,62,42
chr12 120636357 120636551 chr12:120636803:120636657:120636551:120636357:120635265:120635125 -0.066 - SE 0,0,1,0,2 44,62,42
chr15 63446259 63447820 chr15:63447930:63447820:63446259:63446052 0.044 - RI 188,248,202,255,429 179,123,62
- Example:
AS ID Definition and Renaming Rule [ Top ]
- AS ID
In order to query AS events, input file should include AS ID that we defined. AS ID rule is obviously simple to create from gene model or AS analysis result. We require AS ID format including chromosomal positions of exon boundaries starting with chromosome name and delimiting character ‘:’.
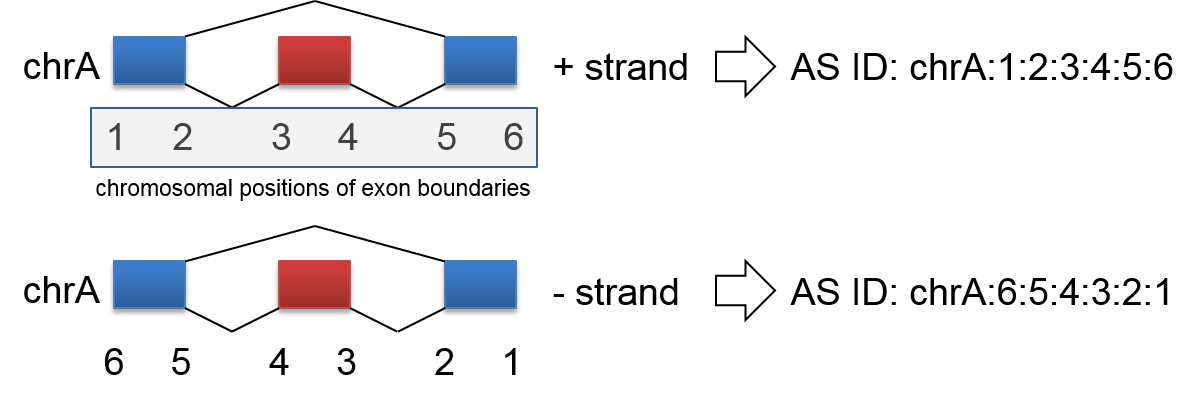
An example of AS ID creation to be SE event - Renaming rule
Our AS ID is appropriate to identify AS event, but not informative for user. Therefor we renamed ASpedia AS ID by following below rules.
Rename values
as_type: A3SS, A5SS, SE, MXE, or RI
transcript_id: corresponding transcript ID
exon_num: exon number of major transcript or single transcript involving AS event
event_type: + or – value. + means exon inclusion event, and – is exclusion.
Rename rule
1. AS event involving major transcript (transcription 1 or UniProt isoform)
as_type: exon_num(event_type)
2. AS event not involving major isoform, but identifiable single isoform.
as_type: transcript_id, exon_num(event_type)
3. AS event involving multiple isoforms except major isoform.
as_type: Involving multiple isoforms
For example,- AS event of ESRRG, ‘A3SS: Exon 7(+)’ means that AS event is A3SS and exon 7 is included in main transcript.
- In case of ESRRG, ‘MXE: ENST00000493748,Exon 3(+)’ means that AS type is MXE and exon3 is included in transcript ENST00000493748.
- AS ID
Result Download File Format [ Top ]
Category Colume name Description of values Example Gene profile gene_symbol HGNC approved gene symbol. TP73 chr Chromosome. chr1 as_id Alternative splicing ID. chr1:3645891:3646012:3647491:3647629:3648027:3648120 as_description_id Renamed alternative splicing ID. SE: Involving multiple isoforms as_type Alternative splicing type. SE strand Strand orientation of genomic coordinates. + gene_name HGNC approved name for the gene. tumor protein p73 locus_group A group name for a set of related locus types as defined by the HGNC. protein-coding gene location Cytogenetic location of the gene. 1p36.32 gene_id REFSEQ or ENSEMBL gene ID. ENSG00000078900 transcript_id REFSEQ or ENSEMBL transcript ID. ENST00000346387,ENST00000604479,
ENST00000378280,ENST00000604566exon_inclusion_transcript_id Transcript id included by this alternative splicing. ENST00000346387,ENST00000604479 exon_exclusion_transcript_id Transcript id excluded by this alternative splicing. ENST00000378280,ENST00000604566 GO_BP Gene Ontology terms describing pathways and processes of given gene symbol. APOPTOSIS GO;POSITIVE REGULATION OF TRANSCRIPTION GO_CC Gene Ontology terms describing localization of given gene symbol. MITOCHONDRION;NUCLEUS GO_MF Gene Ontology terms describing molecular activity of given gene symbol. DNA BINDING;TRANSCRIPTION FACTOR ACTIVITY Conservation conservation_score Average conservation scores of exonic and intronic regions for this AS region. Conservation scores are reported by each database, exon and intron information is in parentheses. hg19.100way.phastCons:(E)0.304/(I)0.041;
phastCons46way.placentalMammals:(E)0.234/(I)0.045;
phastCons46way.primates:(E)0.253/(I)0.072;
phastCons46way.vertebrate:(E)0.326/(I)0.041Variant dbSNP_variant Variants (point mutations) of splicing site in dbSNP for this AS regions. dbSNP IDs, position of point mutations, refs, and alts are reported. rs368114063,chr17:76212746,G>A;
rs67347443,chr17:76221717,C>CTCOSMIC_variant Variants (point mutations) of splicing site in COSMIC for this AS regions. Position of point mutations, refs, and alts are reported. chr6:3646012,CG>C;chr6:3646013,G>A SPIDEX_variant Variants (point mutations) of splicing site in SPIDEX for this AS region. Position of point mutations, refs, and alts are reported. chr4:3645891,G>A/C/T;chr4:3645892,T>A/C/G miRNA miRNA_binding_site miRNA binding sites of 3’ UTR region predicted by TargetScan for this AS region. miRNA binding regions and miRNA IDs are reported. chr10:2038702-2038709,miR-125/351;
chr5:2038405-2038413,miR-153Repeat repeat Overlapping repeats regions with this AS region. Repeat database names and repeat regions are reported. And only RepeatMasker is reported repeat class information. RepeatMasker,SINE,chr17:304973-305104;
Simple Repeats,chr3:305848-305880NMD NMD NMD sites in known stop codons for this AS region. Chromosomes and NMD sites are reported. chr12:120636530;chr12:120636541 COSMIC_NMD NMD sites in novel variant stop codons inferring from COSMIC for this AS region. Chromosomes and NMD sites are reported. chr10:103344469;chr10:103344504 dbSNP_NMD NMD sites in novel variant stop codons inferring from dbSNP for this AS region. Chromosomes and NMD sites are reported. chr10:70644615;chr10:70645026 Protein domain protein_domain Protein domain using Pfam for this AS region. Pfam domain ID, Pfam domain name, and genomic region are reported. And if the information of proteomic region is available, also reported. PF07647,SAM domain (Sterile alpha motif),
415-478,chr8:3647601-3649379Post-translational modification (PTM) protein_translational_modification PTM sites collected from PhosphositePlus for this AS region. PTM types, proteomic regions, and genomic regions are reported. Chain,p310-1400,chr2:49924743-49940115;
Phosphorylation site,AA1056-1056,chr11:49932703-49932705RBP RBP_splicing_factor Summary of RBP around alternative splicing regions, and peak detection p-values. Target proteins, p-values, peak genomic region, and peak length are reported. HNRNPU,6.533499884e-07,chr15:3649426-3649497,72;
SF3B1,1.022357417e-08,chr1:3647540-3647574,35Tissue specific alternative splicing tissue_as Tissue specific PSI values using rMATS for this AS region. Tissues and psi values are reported. And only tissues with |psi-value| >= 0.05 are reported. brain:-0.638;thyroid:0.362 Protein interaction (PPI) isoform_PPI_a Transcript IDs in this isoform. ENST00000378288;ENST00000378295 isoform_PPI_b Protein interaction partners with isoform_PPI_a. ITCH/TP73/NEDD4/UBC;
WWOX/HMGB1/PIN1/MAGEA2B/E6/TP73/YAP1Subcellular localization isoform_subcellular_localization_id Transcript IDs in this isoform. Q9HBH9-1;Q9HBH9-2 isoform_subcellular_localization Isoform specific Subcellular localizations. Cytoplasm;Nucleus > PML body
Data process workflow for differential AS analysis [ Top ]
1. Differential alternative splicing analysis
1) rMATS analysis method
rMATS analyzes alternative splicing events; skipped exon (SE), alternative 5' splice site (A5SS), alternative 3' splice site (A3SS), mutually exclusive exons (MXE), and retained intron (RI). Possible alternative splicing events are identified from the RNA-Seq data and annotation of transcripts in GTF format. All output files are in your specified output directory. For alternative splicing annotation, you can use MATS_output folder or “AS_Event.MATS.JunctionCounts.txt” files. More information about output files is available http://rnaseq-mats.sourceforge.net/user_guide.htm
1-1) rMATS example
|
$python RNASeq-MATS.py –b1 SF3B1_mut.bam –b2 SF3B1_wt.bam –gtf hg19_gen_annot.gtf \ –o SF3B1wt_vs_mut –t paired –len 50 |
Note that the output directory structure is:
|
SF3B1wt_vs_mut ├----- ASEvents ├----- MATS_output | |------ A3SS.MATS.JunctionCountOnly.txt | ├------ A3SS.MATS.ReadsOnTargetAndJunctionCounts.txt | └------ ... ├----- summary.txt ├----- ASEvents/ ├----- SAMPLE_1/ ├----- SAMPLE_2/ ├----- commands.txt └----- log.RNASeq-MATS |
Now run converter.jar (Go on 2. Running converter tool for alternative splicing annotation)
2. Running converter tool to prepare ASpedia input file
To identify alternative splicing event annotation, you should upload the alternative splicing lists of bed format. For user convenience, we provide a tool converting to bed format from analysis result file using rMATS and MISO. We are not require ‘chr’ prefix in chromosome naming, namely you can use either ‘chr1’ or ‘1’. But our converter tool provides the chromosome name with ‘chr’ prefix .
1) First, Download the jar file (DASEResultConvertor.jar) in UTIL page
2) Input requirements
2-1) rMATS
- Output directory (eg. MATS_output folder) or- Each AS_event files (eg. A3SS.MATS.ReadsOnTargetAndJunctionCounts.txt)
2-2) MISO
- The summarizing output files with the Bayes factors with each AS_event (eg. *.miso_bf)3) Examples
To convert your result file, use the following command line each used tool:3-1) rMATS example
|
$java –jar DASEResultConvertor.jar -i SF3B1wt_vs_mut/MATS_output/ \ -o SF3B1wt_vs_mut.aspedia.bed \ -p rMATS # or $java –jar DASEResultConvertor.jar -i A3SS.MATS.ReadsOnTargetAndJunctionCounts \ -o A3SS_SF3B1wt_vs_mut.aspedia.bed \ -p rMATS -a A3SS |
While your job processed, you can check your job status and your data type as below:
|
CONVERTING STATUS: starting file conversion using SF3B1wt_vs_mut/MATS_output//A5SS.MATS.ReadsOnTargetAndJunctionCounts.txt CONVERTING STATUS: starting file conversion using SF3B1wt_vs_mut/MATS_output//A3SS.MATS.ReadsOnTargetAndJunctionCounts.txt CONVERTING STATUS: starting file conversion using SF3B1wt_vs_mut/MATS_output//MXE.MATS.ReadsOnTargetAndJunctionCounts.txt CONVERTING STATUS: starting file conversion using SF3B1wt_vs_mut/MATS_output//SE.MATS.ReadsOnTargetAndJunctionCounts.txt CONVERTING STATUS: starting file conversion using SF3B1wt_vs_mut/MATS_output//RI.MATS.ReadsOnTargetAndJunctionCounts.txt ***FINAL REPORT*** Finally total 219151 ASEs were converted from your input. The output file includes 19132 A5SS, 38721 A3SS, 37998MXE, 116164 SE, and 7136 RI events. |
3-2) MISO example
|
$java –jar DASEResultConvertor.jar -i SF3B1wt_vs_mut/SF3B1wt_vs_mut.A3SS \ -o A3SS_SF3B1wt_vs_mut.aspedia.bed \ -p MISO –a A3SS # or $java –jar DASEResultConvertor.jar \ -i SF3B1wt_vs_mut/SF3B1wt_vs_mut.A3SS/bayes-factors/SF3B1wt_vs_mut.A3SS.miso_bf \ -o A3SS_SF3B1wt_vs_mut.aspedia.bed \ -p MISO –a A3SS |
While your job processed, you can check your job status and your data type as below:
|
CONVERTING STATUS: starting file conversion using SF3B1wt_vs_mut/MATS_output/SF3B1wt_vs_mut.A3SS/bayes-factors/SF3B1wt_vs_mut.A3SS.miso_bf ***FINAL REPORT*** Finally total 38701 ASEs were converted from your input. The output file includes 38701 A3SS events. |
4) Converted ASpedia BED format
The specification of ASpedia BED format is described in HELP page.If you follow the format and AS ID rule, user could query other differential AS analysis result in ASpedia.
3. Searching alternative splicing event annotation
For searching alternative splicing event annotation, you should upload bed formatted file with alternative splicing lists obtained from convertor tool.Once you have uploaded the AS lists, you could get results on website or e-mail.
3-1) Getting results from website
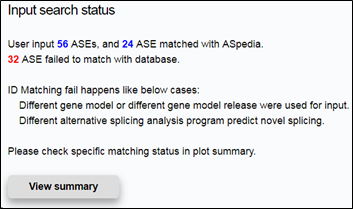
To just get results from website, select ‘in screen’ from the drop-down lists and click on the Search (in Gene symbol search mode) or Submit button. And then you can check status and results with annotated AS lists of your input(If you uploaded your AS lists as attached file, check your input search status and click on View summary button as below).
3-2) Getting results via e-mail
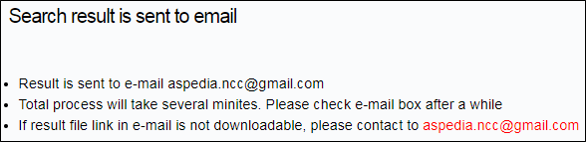
We offer to receive your results by e-mail. To get results via e-mail, select ‘e-mail’ from the drop-down lists and enter your e-mail address in the Email box.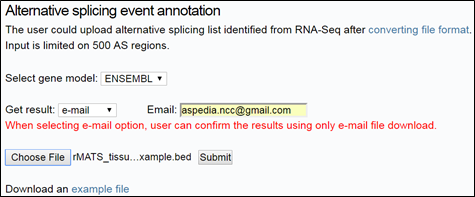
Now, the page for notifications will be displayed as shown below and you will receive e-mail in a few minutes when the download of the result reports with annotating the AS lists you uploaded is available .
Introduction
ASpedia2 provides knowledge-based splicing signatures involved in pathway regulation. Text-mining technology was applied to extract pathway-related splicing genes from 63,229 published abstracts of human alternative splicing. Out of 442 pathways referred from various databases, users can retrieve a pathway of interest and access co-occurred splicing genes showing reliable associations based on numerous test measurements. Pubmed IDs of the relevant abstracts can also be accessed.
User Guide
Step 1) Pathway search
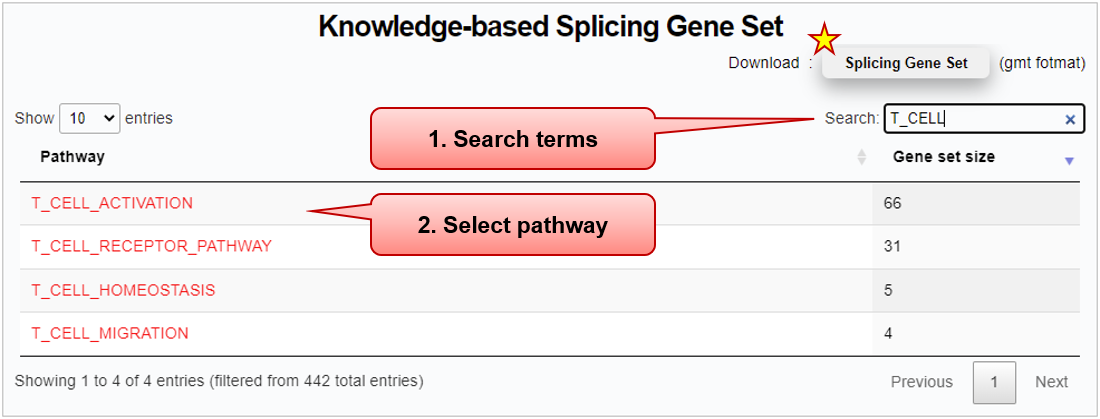
■ "Gene set size" indicates the total number of corresponding splicing gene signatures. Users can sort the summary table by this value.
■ (Star symbol) Users can download (.gmt) the entire knowledge-based splicing gene sets of all pathways and corresponding reference databases.
Step 2) Results – splicing gene signatures
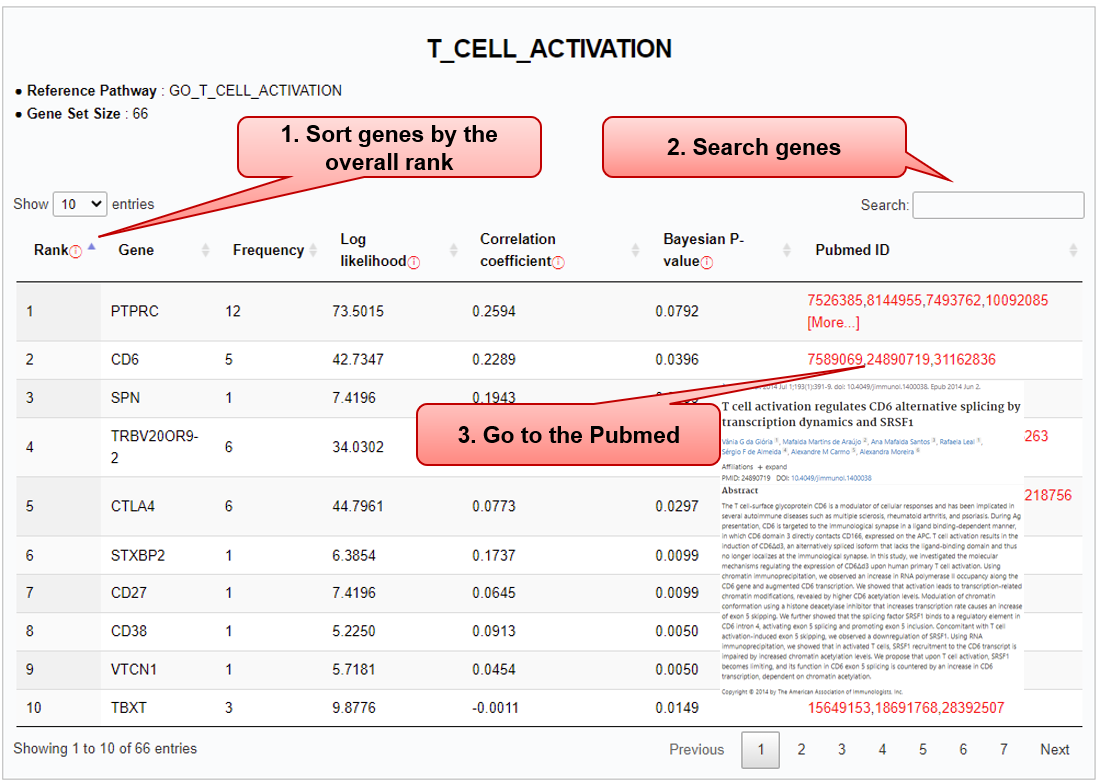
■ Databases referred for the selected pathway are listed.
■ Associated splicing genes of “Gene set size” are summarized in the table, where a gene of interest can be searched.
Column name Description Rank The overall rank integrating three co-occurrence test measures (log likelihood, correlation, and Bayesian P-value), using the Monte Carlo method of rank aggregation, TopKLists [PMID: 25968440] Gene HGNC approved gene symbol Frequency The number of observed gene-pathway pairs within a sentence Log likelihood Log-likelihood for 'gene' and 'pathway' occurrence vectors Correlation coefficient Pearson correlation coefficient value between 'gene' and 'pathway' occurrence vectors Bayesian P-value Bayesian probability of event 'gene' occurring given that 'pathway' Pubmed ID List of abstracts from which the splicing gene is extracted based on its co-occurrence with pathway term
Introduction - AS Signature Regulating Cancer Pathway
ASpedia2 provides transcriptome-based splicing signatures regulating cancer pathways. Machine learning methods were applied to learn models capturing associations between AS events and pathway activity. The TCGA transcriptome datasets of 16 cancer types and 42-cancer related-pathway gene sets were used for training models. The learned models were systematically evaluated, and AS event signatures were extracted based on the models’ feature importance measures. The AS signatures were augmented by the knowledge-based splicing gene signatures obtained from our text-mining analysis. For each pathway per cancer type, users can browse 1) splicing profiles (PSI) of AS event signatures and 2) clinical profiles for pathways and a specific AS event signature (survival analysis, comparison by molecular subtypes, immune and stromal cells, and tumor purity estimates).
User Guide
Step 1) Cancer type and pathway selection
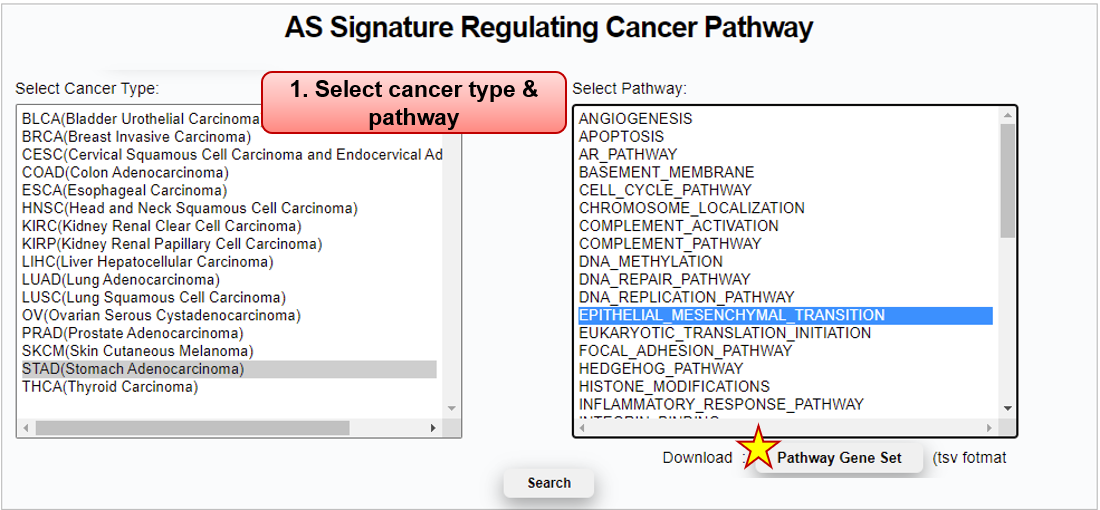
Pathway Reference_DB Gene_set_size Gene_set COMMON_AR_PATHWAY PID_AR_PATHWAY,
WP_ANDROGEN_RECEPTOR_SIGNALING_PATHWAY23 AKT1, AR, …, ZNF318 COMMON_CELL_CYCLE_PATHWAY KEGG_CELL_CYCLE,
REACTOME_CELL_CYCLE,
WP_CELL_CYCLE123 ABL1, ANAPC1, …, ZBTB17 HALLMARK_EPITHELIAL_MESENCHYMAL_TRANSITION HALLMARK_EPITHELIAL_MESENCHYMAL_TRANSITION 200 ABI3BP, ACTA2, …, WNT5A
Step 2) Browse splicing profiles
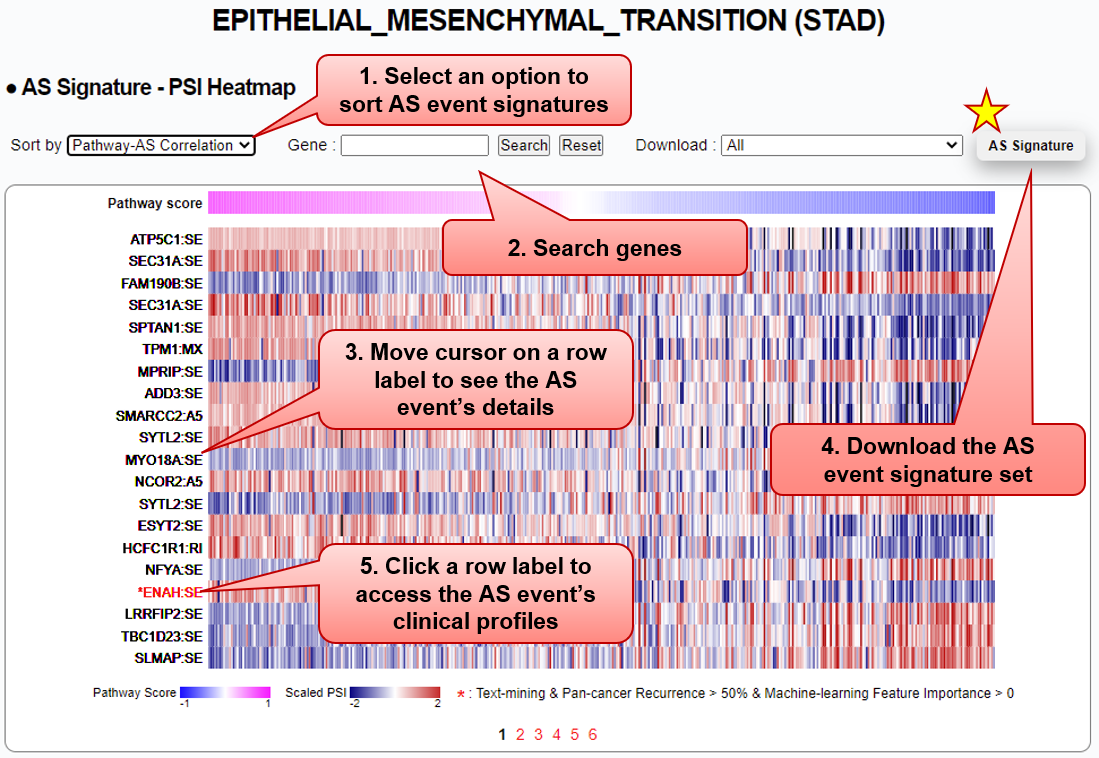
■ Splicing profiles (PSI) of the AS event signature set are depicted in a heatmap. Columns of the heatmap are sorted by patient-level pathway activity scores, computed via GSVA (the higher, the more activated). Users can sort the AS event signatures by choosing one of the options from
1) Pathway-AS Correlation (Spearman’s rho between GSVA scores and PSI values),
2) ML-Feature Importance (predictive scores from the learned Random Forest model),
3) Gene (in alphabetical order), and
4) Text-Mining (overlapped with knowledge-based splicing genes).
■ A signature event (red) with an asterisk indicates 1) its spliced gene is also captured by our text-mining analysis, and 2) its predictive power for the pathway activity level is observed at least across 50% of 16 cancer types.
■ Users can download (.tsv) the entire or subsets of AS event signatures with the following details:
Column name Description Example Pathway 42 cancer pathways EPITHELIAL_MESENCHYMAL_TRANSITION Cancer 16 TCGA cancer types STAD Gene Symbol | ID ENAH|55740 Strand +/- - AS_event_type RI (Retained intron); A3 (Alternative 3' splice site); A5 (Alternative 5' splice site); MX (Mutual exclusive exons); SE (Skipped exon) SE AS_event_ID ID following SUPPA2 format [PMID: 29571299] chr1:225688772-225692693:225692755-225695653 Text_mining_gene "Observed", when the AS gene is also identified by text-mining analysis;
"", otherwiseObserved AS_event_importance Measured as the learned Random Forest (RF) model's feature importance (the higher, the more predictive effects) 3.39 AS_event_correlation Measured as the spearman's correlation between GSVA scores (degree of pathway enrichment) and PSI values -0.5941 Cancer_recurrence Cancer type recurrence (% out of 16 cancer types) of which the AS event shows positive feature importance (RF model) 81.25
Step 3) Browse clinical profiles
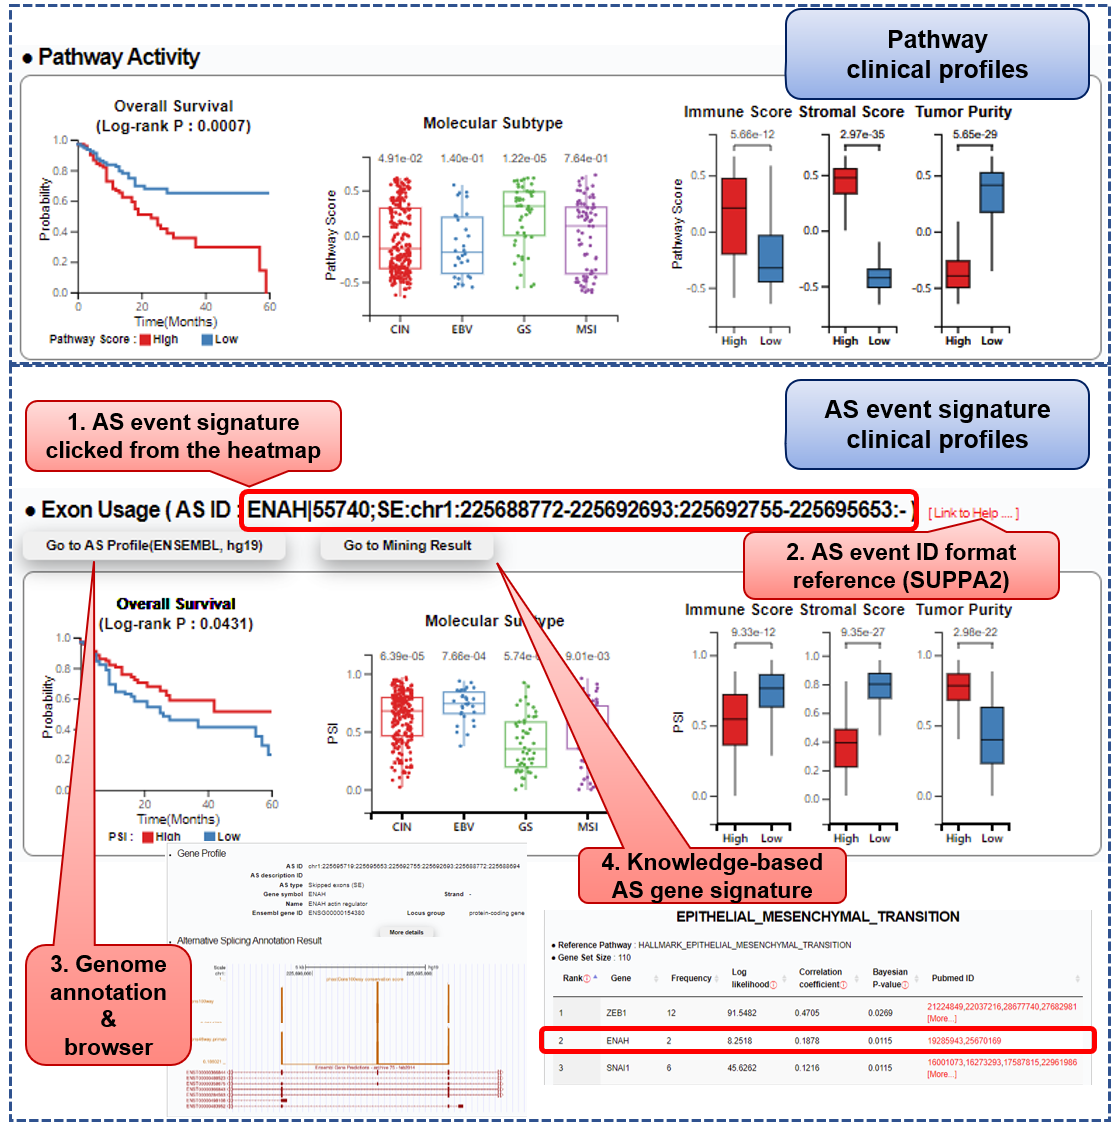
■ The Kaplan-Meier model is used to plot patients' overall survival. The log-rank test is performed for a statistical comparison between two subgroups of patients, using Q1 and Q3 of pathway scores (top) and PSI values (bottom) as thresholds, respectively.
■ Pathway scores and PSI values of a selected AS event signature are compared between 1) molecular subtypes of a given cancer type, 2) two subgroups of high (Q3) and low (Q1) immune scores, stromal scores, and tumor purity, respectively (calculated via ESTIMATE algorithm). The significance of the difference between groups is assessed using the Wilcoxon-rank sum test.
■ Users can click a row label of the specific AS signature event from the PSI heatmap. Then, the selected event's clinical profiles are displayed under the "Exon Usage" part. Its ID follows SUPPA2 format showing the corresponding gene symbol, AS type, genomic coordinates, and strand. If available in our database, users can further access the event's annotation results ("Go to AS Profile" button) and splicing gene captured in our text-mining analysis ("Go to Mining Result").
Introduction
Cancer neo-junctions derived from variants on cis-acting elements play a critical role as a neo-antigen to bind with major histocompatibility complex (MHC). We acquired coordinates of 241,254 neo-junctions over 32 cancer types from a previous study of the pan-cancer transcriptome [PMID: 30078747].
ASpedia2 provides, for each neo-junction:
1) genomic profiles, including gene name, ID, and protein-coding frame,
2) profiles of non-synonymous mutations observed in flanking regions of the junction,
3) profiles of MHC class I/II alleles predicted to have a strong binding affinity with the junction’s translated peptides, and
4) comparison plots of gene expression levels and immune scores between patients with and without the neo-junction across cancer types
User Guide
Step 1) Neo-junction search & summary of search results
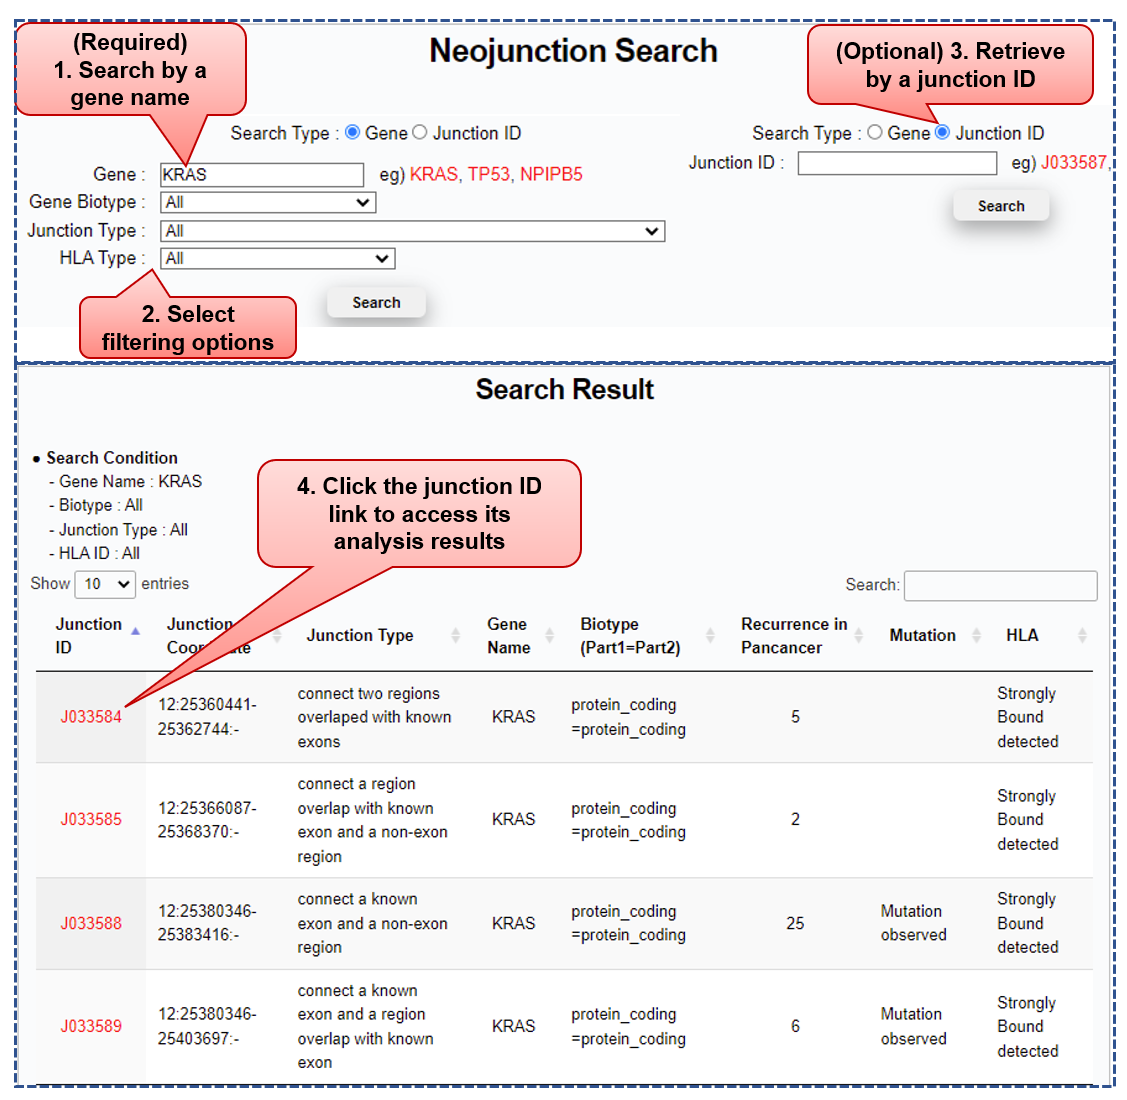
■ Required to search neo-junctions by a gene symbol
■ Users can select filtering options among
1) Gene biotypes (such as protein-coding, lincRNA, sense intronic.),
2) Junction types (such as connect two non-exon regions, gene fusion, novel AS junction), and
3) HLA types (such as HLA-A, HLA-B, HLA-DR, HLA-DP).
Column name Description Example Junction ID ID in Jxxxxxx format; total 241,254 neo-junctions analyzed; [PMID: 30078747] J078976 Junction Coordinate (Chromosome):(Coordinates of end points at the junction):(Strand); [PMID: 30078747] 17:7578272-7578370:- Junction Type Neo-junctions classified into seven categories, following CustomProDB's rules; [PMID: 24058055] Connect two regions overlapped with known exons Gene Name HGNC approved gene symbol TP53 Biotype (Part1=Part2) Two components of a neo-junction (Part1 & Part2) annotated separately (Ensembl);
each corresponding biotypes concatenated by "=";protein-coding=protein-coding Recurrence in Pancancer Total number of patients with the neo-junction across 32 cancer types 52 Mutation "Mutation observed", when a non-synonymous mutation occurs in flanking regions (+/- 500 bp) of the neo-junction;
"", otherwiseMutation observed HLA "Strongly Bound detected", when any polypeptide generated by the neo-junction is predicted to have strong binding affinity with any MHC allele (81 class I and 54 class II HLA types)
"", otherwiseStrongly Bound detected
■ Neo-junctions satisfying a user's selected conditions are summarized in a table.
■ Users need to click the junction id to see specific analysis results, including 1) genomic annotations (e.g., gene, transcript, exon, protein), 2) cis-acting element profile (e.g., mutation), 3) MHC alleles strongly bound to the neo-junction’s polypeptides, 4-6) patient recurrence, gene expression level, and immune score comparisons over 30 cancer types.
Step 2) Neo-junction analysis results
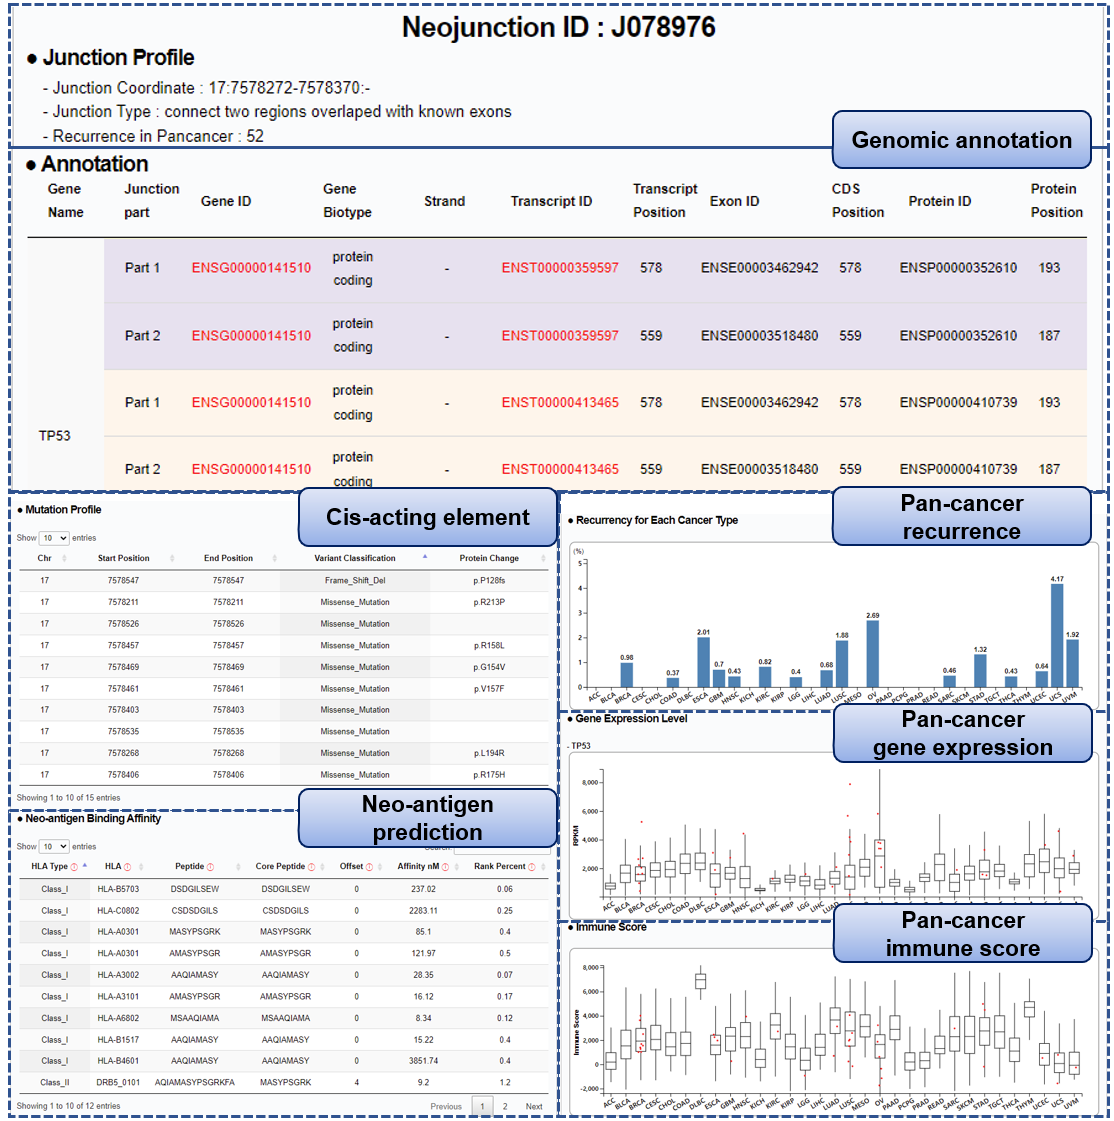
■ Annotation: Two genomic components (Part1 & Part2) joined by a neo-junction are annotated separately using the Ensembl database. For a case where multiple annotations exist in the junction’s genomic region, possible annotations are listed in pairs. Users can navigate to the Ensembl database webpage by clicking IDs in red font.
■ Mutation Profile: : Simple somatic SNVs were downloaded via TCGAbiolinks [PMID: 26704973]. Duplicated variants were filtered out, and only non-synonymous mutations were considered for our analysis using maftools [PMID: 30341162]. We captured mutations in the junction’s flanking regions (+/- 500bp) via bedtools-intersect [PMID: 20110278] and dropped neo-junctions of mutation noise (> 9 per patient).
■ Neo-antigen Binding Affinity: : Out of 241,254 cancer neo-junctions from the previous study [PMID: 30078747], we extracted peptide sequences for 241,142 neo-junctions using CustomProDB [PMID: 24058055]. NetMHC and NetMHCII were applied to predict binding affinities between the translated junction peptides and HLA allele candidates [PMID: 26515819, 29315598]. All 81 HLA class I alleles and 54 HLA class II alleles are assessed to predict their binding affinity (9-mer based analysis for NetMHC, and 15-mer based analysis for NetMHC II; default settings, otherwise). Our database only covers strongly bound pairs of neo-junction-peptide and MHC alleles.
Column name Description Example HLA Type Major histocompatibility complex (MHC) class types Class_II HLA HLA molecule allele DRB5_0101 Peptide Amino acid (AA) sequence of the potential ligand (junction peptides) AQIAMASYPSGRKFA Core Peptide The minimal 9 AA binding core directly in contact with the MHC MASYPSGRK Offset The starting position of the Core within the peptide 4 Affinity nM Predicted binding affinity in nanoMolar units 9.2 Rank Percent Rank of the predicted affinity compared to a set of random natural peptides 1.2
■ Recurrence for each Cancer Type: Bar plots show the ratio (percentage) of patients with the neo-junction for each cancer type.
■ Gene Expression Level: Raw expression levels (RPKM) of the neo-junction's gene are depicted for each cancer type. Red points indicate patients in which the junction occurred.
■ Immune Score: Boxplots depict levels of infiltrating immune cells, computed via ESTIMATE algorithm [PMID: 24113773], across 30 cancer types. Red points indicate patients in which the neo-junction occurred.